Showing posts with label maps. Show all posts

Monday

57 Interesting World Maps

I came across this page called '57 maps that will challenge what you thought you knew about the world' on StumbleUpon.
There are some really interesting, as well as some really funny, map data visualisations that are worth checking out.
I've included some of my favourites below but it's really worth having a look at the page as they are all pretty good.


I also found this Yelp Worldmap which is a heat map showing the hipster density in New York which I found quite funny.
The map works by using data from reviews, so when calculating hipster density Yelp will have used reviews that mention the word 'hipster' and gone from there, pretty clever.


You can customise a map to see certain things, picking a city and then a thing that you'd like to see the density of in that city.
I chose London as my city and cocktails as my thing to see.


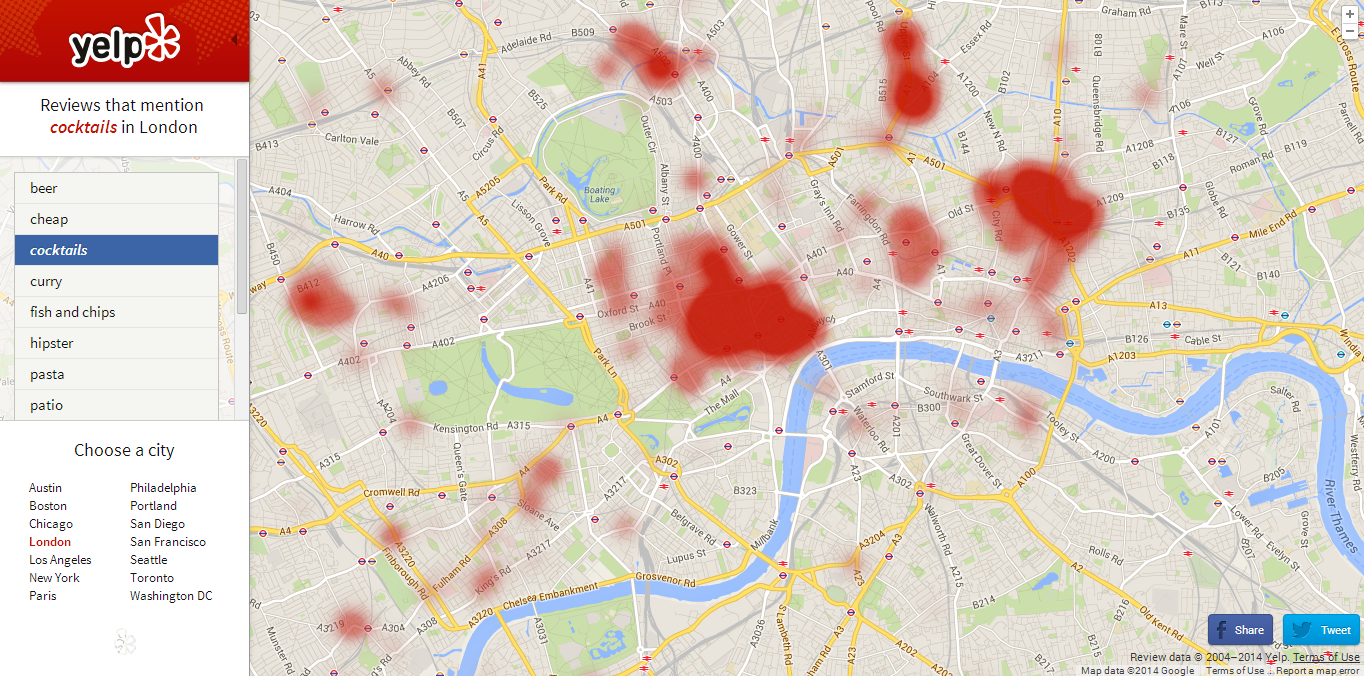
As well as being quite amusing and fun to play around with, Yelp Worldmap could actually be a pretty useful thing to use if you're looking for a certain thing and are not sure where to go.


Wednesday

Data Visualisation

This week I've been looking into the world of data visualisation.
Data visualisation is, as the name suggests, the digital visualisation of data, and is a way to represent data clearly and effectively (often in a creative way).
A website I've been looking at that has lots of interesting examples of different forms of data visualisation is Visual Complexity, which has examples ranging from things such as maps of locations on Foursquare to visual overviews of music albums (I've still no clue how that works but it does!)


Graph using locative devices - Visual Complexity


Graph visualising band Dead Kennedys' five studio albums - Visual Complexity

I find these examples of Visual Complexity really fascinating but at the moment have no idea how to go about making my own so need to really look into it!
There are some other good sites like We Love Datavis, which is a Tumblr site, that give further examples of what people have done, so I'm going to have more of a look and investigate this data visualisation business...