Thursday

Heatmap of Tripadvisor's Most Visited Restaurants

Unfortunately Google Fusion doesn't let you publish heatmaps for geocoded addresses, so instead I've taken screenshots of the effect, which you can see below.
The redder the heatspot, the more people have visited the place and left reviews on Tripadvisor.

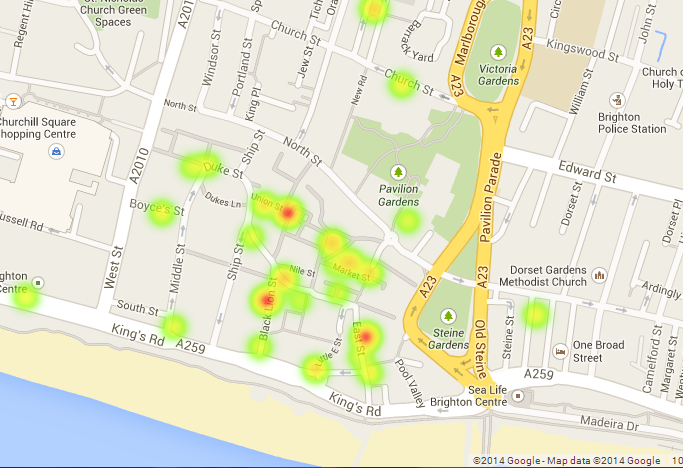


It's cool how the further you zoom out, the more the heatspots blur into one...


Most Visited Restaurants in Brighton According to Tripadvisor

Click on the markers for photos and information about each of the restaurants, such as the name, how many reviews of the place there are on Tripadvisor, and its Tripadvisor ranking out of all the restaurants in Brighton (of which there are 797 in total).

Wednesday

Different proportion of cuisines in Brighton

Here I've made my own Data Visualisation graph, showing the proportion of all of the different cuisines in Brighton. I've got my data from Trip Advisor, so am relying on that for the accuracy of my data.
As you can see, apparently the cuisine with the most restaurants in Brighton is British cuisine, which is probably including pubs as there are a lot of pubs in Brighton!


undefinedAfrican: 4AfricanAmerican: 28AmericanAsian: 17AsianBritish: 187BritishCaribbean: 2CaribbeanChinese: 16ChineseFrench: 22FrenchFusion: 5FusionGerman: 2GermanGreek: 5GreekIndian: 30IndianIrish: 1IrishItalian: 49ItalianJapanese: 13JapaneseMediterranean: 21MediterraneanMexican: 9MexicanMiddle Eastern: 13Middle EasternSeafood: 19SeafoodSouth American: 3South AmericanSpanish: 11SpanishThai: 37ThaiVegetarian: 20VegetarianVietnamese: 2Vietnamese

Further Data Visualisation Example

The data visualisation below is a slight variation of the graph below.
It is using the same data - cocktail recipes - but displaying that data in a different form, that some people may or may not prefer.
I personally prefer the data visualisation in the previous post as I think it's more interesting to look at, but there are many different options with which to display data on Raw.


Data Visualisation Example Using 'Raw' App - Pretty Cool!

undefined9Bloody Mary: 1Bloody MaryJager Monster: 1Jager MonsterDaiquiri: 1Daiquiri18Bloody Mary: 1Bloody MaryMint Julep: 1Mint Julep3Bloody Mary: 1Bloody MaryCosmopolitan: 2CosmopolitanApple Martini: 2Apple MartiniLong Island Iced Tea: 5Long Island Iced TeaMargarita: 1MargaritaCaribou Lou: 1Caribou LouWhiskey Sour: 1Whiskey Sour12Gin and Tonic: 1Gin and TonicMojito: 1MojitoCuba Libre: 1Cuba Libre29Gin and Tonic: 1Gin and Tonic10Screwdriver: 1ScrewdriverWhite Russian: 1White Russian20Screwdriver: 1Screwdriver4White Russian: 1White RussianMargarita: 1MargaritaDaiquiri: 1DaiquiriSex on the Beach: 1Sex on the BeachB-52: 3B-526White Russian: 1White RussianCosmopolitan: 1CosmopolitanLong Island Iced Tea: 1Long Island Iced TeaMudslide: 4MudslideKamikaze: 3KamikazeMojito: 1MojitoCaribou Lou: 1Caribou LouCuba Libre: 1Cuba LibreJager Monster: 1Jager MonsterPina Colada: 3Pina Colada8Cosmopolitan: 1CosmopolitanApple Martini: 1Apple MartiniMojito: 1MojitoSex on the Beach: 3Sex on the Beach5Long Island Iced Tea: 1Long Island Iced Tea7Margarita: 1Margarita1Mojito: 2MojitoDaiquiri: 1DaiquiriWhiskey Sour: 1Whiskey SourMint Julep: 2Mint Julep2Whiskey Sour: 1Whiskey Sour

Problems...

I've just noticed an interesting occurrence on my blog. Ever since adding the posts with the Scribble Maps my blog seems to have stopped working properly. The sidebar is not showing up at the side on the homepage and any links on the page seem to have stopped working.
However, if you go onto one of the other pages listed along the top, such as 'Theory and Readings', everything is working fine there, meaning it is just the home page with all the regular blogposts on.
This is just slightly frustrating but I thought it's quite interesting as it's an example of a kind of glitch in the system. Perhaps Scribble Maps is too much for the page to handle and it's rejecting the maps by breaking my page!
I may have to create a whole separate page for the maps as I can't really have a blog that doesn't properly work...

Data Visualisation

This week I've been looking into the world of data visualisation.
Data visualisation is, as the name suggests, the digital visualisation of data, and is a way to represent data clearly and effectively (often in a creative way).
A website I've been looking at that has lots of interesting examples of different forms of data visualisation is Visual Complexity, which has examples ranging from things such as maps of locations on Foursquare to visual overviews of music albums (I've still no clue how that works but it does!)


Graph using locative devices - Visual Complexity


Graph visualising band Dead Kennedys' five studio albums - Visual Complexity

I find these examples of Visual Complexity really fascinating but at the moment have no idea how to go about making my own so need to really look into it!
There are some other good sites like We Love Datavis, which is a Tumblr site, that give further examples of what people have done, so I'm going to have more of a look and investigate this data visualisation business...